| Previous | Table of Contents | Next |
Some Compression Results
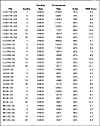
The disk included with this book contains five grey-scale files to experiment with. Some of the results of compressing these files using the DCT program is shown in Figure 11.14.

Figure 11.14 Compression results
On most of the images, compression quality figures of five or lower produce a slight loss of resolution, but no significant loss of picture quality. Once the quality factor gets above five, visible artifacts of the compression process start to become visible as “blocking” of the image.
Figure 11.15 shows a few images of CHEETAH.GS after going through a compression cycle. The first few images look fairly good. In fact, it is hard to spot much of a difference. Viewing the images one immediately after the other using GS.EXE will clearly show that there have been changes, but they are not glaring differences. At quality 5, close inspection shows a few areas where the compression is clearly starting to cause picture quality to slip. The images with quality factors 10, 15, and 20 show clear degradation.
Figure 11.15 CHEETAH.GS after a compression cycle.
The compression results achieved from these experiments are quite impressive. In most cases, images can be compressed up to about 85 percent without losing much picture quality. Better compression than this could be expected from the JPEG algorithm, since it adds a Huffman coding stage which DCT.C lacks.
| Previous | Table of Contents | Next |


