| Previous | Table of Contents | Next |
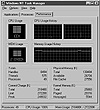
Believe it or not, you can eliminate problems before they occur. How? By becoming familiar with the tools you use to measure performance. Then, you can use these tools to build a performance database that you can use to compare previous results with current results. You can also use the tools in realtime to look for possible bottlenecks that could be occurring on your server right now. Any bottleneck you eliminate will improve your server’s performance. You can, for example, use the Task Manager (TASKMGR.EXE) to monitor your server’s processor utilization as I do. If you see a processor utilization curve like that shown in Figure 3.1, you know that your server’s processing capacity has far exceeded its limits. If you see a constant 60 to 75 percent usage, it’s time to consider upgrading your server’s processing capability. The idea here is that you want to find potential problems and solve them before they occur.

Figure 3.1 Using the Task Manager to view your server’s processing capacity.
As another example, consider using the Performance Monitor to monitor disk usage, as shown in Figure 3.2. The high spikes you see are caused by an overloaded disk drive. This particular drive is being accessed so frequently that it just cannot keep up with the demand. This high a rate is usually not caused by network activity. Rather, it is caused by a local process running on the server. In fact, this chart was captured using my DISKHOG.EXE sample program. The purpose of this program is to write a large data file to disk to demonstrate the type of activity to look for when isolating an I/O bottleneck. You’ll learn more about this program in Chapter 6, “Tools And Techniques.” But, for now, I’d like to point out another use for the tool.

Figure 3.2 Using the Performance Monitor to view your server’s I/O subsystem capacity.
You can use DISKHOG.EXE to determine a baseline for how fast your I/O subsystem can write data to a disk. You can even pick the disk to test. This baseline is not perfect, but it will give you a means to determine when your I/O subsystem is close to its maximum rated capacity. If you change the chart to examine the physical disk rather than the logical disk characteristics, as shown in Figure 3.3, you can determine the average transfer rate your drive can sustain. In my case, for this particular laptop computer, the average transfer rate is close to 231K/sec., with a maximum transfer rate of 964K/sec. This is far below the actual rated capacity of the drive, but isn’t too far off the mark for actual data transfers in a working system. What are not displayed in this chart are the system requirements for other processes. These processes include overhead for the rest of the background processes (server, workstation, WINS, DHCP, and other services). This particular computer uses an EIDE disk subsystem that relies on the processor for data transfers, so these running processes detract from the overall performance of the I/O subsystem. The chart also does not include the fact that this computer uses a 486/100 processor and only has 16MB of memory. Your server should have a much higher data transfer rate.

Figure 3.3 Creating an I/O subsystem baseline with the Performance Monitor.
The idea behind capturing a baseline figure is that you can use it when monitoring your system’s I/O subsystem performance. If it reaches 80 percent of capacity and maintains this state for any length of time, it is an indication that upgrading your server’s I/O subsystem is probably a good idea. You can replace the hardware, or you can consider creating a stripe set or stripe set with parity to improve your server’s ability to transfer data. Using redundant disk system and fault tolerant systems to improve your I/O system’s data transfer rate is discussed in Chapter 9 “Implementing Redundant Systems.”
You can also use the Performance Monitor to measure the performance of other services. These include the server, workstation WINS, FTP, and other services you have installed. You can even use the Performance Monitor to measure the performance of other BackOffice components, like Exchange Server and SQL Server. Both of these products include pre-built Performance Monitor workspaces for you to use. In the next few chapters, you will get a more in-depth look at how to use some of the tools presented in this chapter along with some of the key performance counters to use when measuring the performance of your server. There are also third-party tools like Bluecurve’s Dynameasure. Dynameasure allows you to put a controlled stress on a distributed computing environment by instructing a number of PC clients to perform work using a Windows NT Server, while recording how much work was performed within a predetermined period of time. Put another way, Dynameasure puts stress on the system using an application and measures the effect the stress had on the system. The basic principle is analogous to a doctor using a treadmill to test a patient’s cardiovascular system while under stress. Dynameasure is built on the premise that the only way to gauge the capacity of a Windows NT computing environment is to put a controlled stress on it. An evaluation version of Dynameasure, shown in Figure 3.4, is provided on the accompanying CD-ROM and can be downloaded from www.bluecurve.com as well.

Figure 3.4 Using Dynameasure to measure your server’s performance.
| Previous | Table of Contents | Next |