| Previous | Table of Contents | Next |
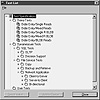
If you look carefully at Figure 3.4, you will see several motors (1 through 5) on the top left. These motors are simulated clients. To the right of motor 5, and directly underneath motor 3, you will see the Manager window. The Manager is used to analyze the results, create the dataset used for testing, and start the Dispatcher (window on the bottom right). Directly underneath the motors is the Operator window. The Operator displays information about the clients (motors). The Dispatcher is really the heart of the application as it is used to determine the tests that will be run. For example, to see the types of test supported by the full product, click on the Add Test button, and the dialog box, shown in Figure 3.5, will appear.

Figure 3.5 Selecting the tests to use with Dynameasure.
As you can see, the tests are subdivided into two basic groups. The Demo Tests are the only ones you can run using the evaluation version of Dynameasure and are based on online transaction processing (OLTP) using an Access database. The retail product, however, includes all the tests outlined in the Dynameasure Test and User Test entries. The Dynameasure Test includes SQL-specific tests as well as the File Service Tests. The File Service Tests include Copy, Backup and Retrieve, and Network Application. Each of these is further broken down into Client to Server, Server to Client, and Bi-directional (both C/S and S/C). If you have the full package, you can use these tests to measure the performance of your server and network. This tool can provide you with significant aid in planning your network’s future requirements. For example, it can help you determine when you will need to add additional servers to handle additional clients. It can help you to determine when your current network’s carrying capacity will be reached based on a specific number of clients and simulated activity. This will tell you when you will need to segment your network to improve performance. Similar tests can be used to tell you how many clients your disk I/O subsystem can support or how many clients your SQL Server can support.
From a performance measuring standpoint, Dynameasure really does live up to its name. It provides a dynamic tool to measure the performance of your system. It can even be used to provide a “what-if” type analysis. By the time this book is published, the next release of Dynameasure will be available, including a new downloadable trial version of Dynameasure. Dynameasure 2.0 will include support for MS Exchange, integration with Windows NT Performance Monitor, ActiveX-based timing and control, and the ability to create custom transactions that work against your own data. From what I hear, this will be a very exciting product and will expand the current capabilities to measure performance in ways that are difficult to imagine.
Summary
This chapter discusses three important topics. First, the chapter presents a philosophical view about performance tuning. I hope you’ll take it to heart during your performance tuning exercises. Secondly, you learned the three golden rules of performance tuning:
- • Performance is relative to the task you want to accomplish.
- • Server performance is relative to the efficiency of a specific subcomponent of your server.
- • Improve the efficiency of one subcomponent, and you will expose the inefficiency of another subcomponent.
- • Server performance is relative to the efficiency of a specific subcomponent of your server.
Finally, measuring the performance of a server should always be based on client responses, and, if possible, you should eliminate problems before they become noticeable to your clients.
| Previous | Table of Contents | Next |