| Previous | Table of Contents | Next |
Using The Performance Monitor Toolbar
The Performance Monitor toolbar, as shown in Figure 4.1, provides quick access to the Performance Monitor feature set. From left to right, the toolbar buttons perform the following functions:
- • View A Chart—Changes the default view to the Chart view.
- • View The Alerts—Changes the default view to the Alert view.
- • View Output Log File Status—Changes the default view to the Log view.
- • View Report Data—Changes the default view to the Report view.
- • Add Counter—Displays the Add To Item dialog, where the item can be either a chart, alert, log, or report. Use this as a quick mechanism to add performance object counters.
- • Modify Selected Counter—Displays the Edit Item Entry dialog when you select an object counter in the legend and press this button. You can use this feature to change an item’s color, scale, line width, and line style if viewing a chart, or other attributes for alerts, logs, and reports.
- • Delete Selected Counter—Deletes the object counter selected in the legend from a chart, alert, log, or report.
- • Update Counter Data—Updates the display when you have set the update time to Manual Update.
- • Place A Commented Bookmark Into The Output Log—Inserts a comment into a log file to refresh your memory of the usage of captured object counters.
- • Options—Displays the Options dialog for the selected view.
TIP: Appendix B contains a highly inclusive list of the performance object counters and their definitions to provide you with an ‘at a glance’ method of choosing the performance counters to best suit your needs. - • View The Alerts—Changes the default view to the Alert view.
)
Figure 4.1 The Performance Monitor toolbar.
Creating Charts
Creating a chart consists of selecting the performance objects, configuring the view, and then saving the chart for future use. You can follow the steps presented in this section to create a chart.
- 1. Make sure the default view, as shown in Figure 4.2, is for a chart. If a different view is displayed, you can click the View A Chart button on the toolbar, choose View|Chart, or press Ctrl+C.
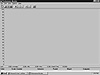
Figure 4.2 The Performance Monitor Chart view.- 2. Next, choose Edit|Add To Chart, press the Add Counter button on the toolbar, or press Ctrl+I. All of these procedures will display the Add To Chart dialog, as shown in Figure 4.3. This dialog is used to select the performance object counters to be monitored.
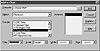
Figure 4.3 The Add To Chart dialog.- 3. Now, choose the event type (performance object) to be monitored in the Object field.
- 4. Then, choose the event subtype (object counter) to be monitored in the Counter field.
TIP: If you are unsure of an object counter’s properties, click the Explain button. This will expand the dialog and display a short description of the counter.- 5. Finally, choose an instance of the object counter, if applicable. An instance is used to differentiate between one or more occurrences of an object counter. Not all object counters include an instance number.
You can select a different source to monitor by specifying the name of a remote computer in the Computer field. Or, you can click the button at the end of the field to display the Select Computer dialog where you can browse the network for the computer you wish to monitor. Once you have selected a computer, repeat Steps 3 through 5. This can be particularly useful if you want to monitor multiple servers simultaneously, for comparison purposes.- 6. To specify a different color for the performance object counter to use for its display, select a color from the Color field.
- 7. To change the default scale for the object counter, select a multiplier or divisor from the Scale field. This can be very useful when a performance counter maxes out at the top of the chart or is too low to be readily visible.
- 8. To change the line thickness displayed in the chart, choose a different setting from the Width field.
- 9. To change the line from a solid line to a series of dashes or dots to differentiate chart lines of the same color, select a pattern from the Style field.
- 10. Once you have made your choices, press the Add button to add the object counter to the Performance Monitor’s display list.
- 11. Repeat Steps 2 through 10 for each object counter you want to monitor. When you have finished, press the Done button to return to the Performance Moni tor Chart view.
To select a range of object counters, select the first counter in the range, then, while holding the Shift key, select the last counter in the range. To select noncontiguous items, select the first counter, and then, while holding the Ctrl key, select other counters. Repeat these same steps for the instance field, if you want to monitor multiple object counters for multiple instances. The Performance Monitor will automatically select a color and line width for each item. - 2. Next, choose Edit|Add To Chart, press the Add Counter button on the toolbar, or press Ctrl+I. All of these procedures will display the Add To Chart dialog, as shown in Figure 4.3. This dialog is used to select the performance object counters to be monitored.
)
)
| Previous | Table of Contents | Next |