| Previous | Table of Contents | Next |
To modify the chart configuration, choose Options|Chart to display the Chart Options dialog, where you may select the following items:
- • Legend—Use this item to display a map legend at the bottom of a chart that contains each monitored item. A legend specifies each item’s color, name, instance, parent, object, and computer.
- • Value Bar—Use this item to display a status bar just above the legend that contains the last value, average value, minimum value, maximum value, and graph time of a selected legend item. The graph time is the time it takes (in seconds) for a performance counter to completely fill the display area.
- • Vertical Grid—Use this item to subdivide a vertical chart axis when selected vertical reference lines are drawn on the displayed window.
- • Horizontal Grid—Use this item to subdivide the horizontal chart axis when selected horizontal reference lines are drawn on the displayed window.
- • Vertical Labels—Use this item to enable or disable the vertical scale numbers displayed on the left of a chart window.
- • Gallery—Use this item to select the chart type. The Gallery can display either a line chart, by selecting the Graph option, or a bar chart, by selecting the Histogram option.
- • Vertical Maximum—Use this item to specify a different maximum scale for the vertical axis. The default is 100.
- • Update Time—Use this item to specify the time when the chart should be updated. You can automatically update a chart by specifying a value (in seconds) for the Periodic Update option or a manual chart update by choosing the Manual Update option. If you select the Manual Update option, then the chart will only be updated when you choose Options|Update Now, the Update Counter Now toolbar button, or Ctrl+U.
- • Value Bar—Use this item to display a status bar just above the legend that contains the last value, average value, minimum value, maximum value, and graph time of a selected legend item. The graph time is the time it takes (in seconds) for a performance counter to completely fill the display area.
Now, after all this work, you should save the chart in case you want to use it again. This is accomplished by choosing the File|Save Chart As option. This command will display the familiar File Save As dialog the first time you save the chart, and it will update the file thereafter. To load a previously saved chart, choose File|Open.
TIP: To save all Performance Monitor views (Chart, Log, Report, and Alert), choose File|Save Workspace. This command will save all chart views and the selected performance counter objects, along with the window placement.
Creating Logs
Creating a log consists of selecting the performance objects, configuring the log options, and then starting the log capture. Once performance data has been captured to a log, you may then load this data back into the Performance Monitor for analysis. Follow the steps in this section to create a log:
- 1. Make sure the default view, as shown in Figure 4.4, is set for a log. If a different view is displayed, you can click the View Output Log File Status button on the toolbar, choose View|Log, or press Ctrl+L.
Figure 4.4 The Performance Monitor Log view.- 2. Next, choose Edit|Add To Log, press the Add Counter button on the toolbar, or press Ctrl+I. Any of these commands will display the Add To Log dialog, as displayed in Figure 4.5.
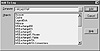
Figure 4.5 The Add To Log dialog.- 3. The Add To Log dialog is used to select the performance object to be monitored. To select an object, highlight the object in the Objects field, then press the Add button. To select a range of object counters, select the first counter in the range, then, while holding the Shift key, select the last counter in the range. To select noncontiguous items, select the first counter, and then, while holding the Ctrl key, select another counter.
TIP: If you are unsure of the events to monitor for your first-time use, select them all. But only capture these events for a maximum of five minutes, as the log file can become quite large. This will give you the opportunity to determine which counters are really of interest to you in determining a specific bottleneck. Once you have limited the counters, you can recapture the data for a longer period.- 4. After you have made your choices, the Cancel button will change to the Done button. Press the Done button to return to the Performance Monitor’s main window.
- 5. At this point, the performance objects will be listed in the Log window. How ever, you are not ready to capture data yet. First, you have to modify the log options to specify a file in which to place the captured data and indicate an update interval. These features are accessible from the Log Options dialog. To display the Log Options dialog, choose Options|Chart, press the Options button on the toolbar, or press Ctrl+O.
Note: To automatically update a log, specify a value (in seconds) for the Periodic Update option. To manually update a log, select the Manual Update option. If you select the Manual Update option, the chart will only be updated when you choose Options|Update Now, press the Update Counter Data button on the toolbar, or execute Ctrl+U.- 6. To start your data capture, press the Start Log button in the Log Options dialog. Once this option has been enabled, the Status field will change from Closed to Open, and the File Size field will display the size of the data capture file. The longer you capture data, the larger this file will be, so you should not capture data on a drive containing your network client files, as this could prevent a client from being able to save the data files. Of course, this assumes that you are capturing a large amount of data over a significant amount of time.
- 2. Next, choose Edit|Add To Log, press the Add Counter button on the toolbar, or press Ctrl+I. Any of these commands will display the Add To Log dialog, as displayed in Figure 4.5.
)
)
Once you have captured all the data you want for analysis, open the Log Options dialog, and click the Stop Log button. This will close the log file. To actually use the captured data, choose Options|Data From to display the Data From dialog where you may load a log file. Once you load a log file, you may then chart it or use it to generate alerts or reports. You can also change the object to log by redisplaying the Add To Log dialog and adding additional objects. However, before you can append these new objects, be sure to select the Options|Data From menu option and change the setting from Log File to Current Activity. You may then use the Start button in the Log Options dialog to append your data to the capture file.
Don’t forget to save your log options by choosing the File|Save Log Setting As menu option.
| Previous | Table of Contents | Next |