| Previous | Table of Contents | Next |
Chapter 6
Tools And Techniques
- • Performance Tuning With The Task Manager
- • Performance Tuning With The Performance Monitor
- • Isolating Processor Bottlenecks
- • Isolating Memory Bottlenecks
- • Isolating Disk Bottlenecks
- • Isolating Network Bottlenecks
- • Performance Tuning With The Performance Monitor
Windows NT Server includes several tools to aid you in optimizing your network server. The Microsoft Windows NT Workstation and Microsoft Windows NT Server Resource Kits include additional tools that, while not required, might prove useful to you in your endeavors. I know the Resource Kit tools have proven themselves useful to me over the years, and I heartily recommend them to anyone managing a Windows NT Workstation or Windows NT Server computer. You will learn more about the Windows NT Server Resource Kit utilities that I find useful later in this chapter. For now, I would like to introduce you to the primary tools you will use with Windows NT Server.
Tools Of The Trade
Two primary tools of the trade, the Windows NT Diagnostics and the Windows NT Event Viewer are located in your Administrative Tools program group and will not be discussed in detail. These tools are primarily used for documentation and troubleshooting rather than optimization—the focus of this chapter. However, because I find these tools to be useful, I at least want to mention a few of the reasons why you may want to use them.
Windows NT Diagnostics is quite useful in documenting your computer’s configuration. You can print a report of your entire system configuration. This includes the current build of Windows NT installed on your computer, motherboard BIOS information, processor configuration, video BIOS and adapter configuration, logical and physical drive information, process and memory information, services and devices, system resources (including IRQ, I/O, DMA, and adapter memory usage), system and user environment, and network information (including general information, network transports, various system service settings, and statistical information). You can even view this information on remote (i.e., network clients) Windows NT computers.
The Windows NT Event Viewer is useful both for informational and troubleshooting purposes. The Event Viewer stores events—ranging from informational to error—in three log files. This includes the system log, the application log, and the security log. The system log is the most important log and contains information about your hardware and system services. The application log contains information about enhancements to the operating system, such as the Microsoft BackOffice components, third-party add-ons, and other applications noncritical to the functioning of the operating system. The security log contains audited events, such as who has logged on or off the system, who has accessed or failed to access specific directories and files, and who has failed to successfully log on to the system (including services with the logon as service right). If you encounter a hardware or service failure, the Event Viewer is the first place you should look, as the information contained in an associated event may be all you need to rectify the situation.
The rest of this chapter focuses on the tools and techniques you will use to optimize your system. Our first stop will be to explore the Task Manager’s ability to give you a quick picture of your system’s overall performance. Then, we’ll move on to using the Performance Monitor to optimize specific subcomponents. We’ll look at sample Performance Monitor workspaces and applications designed to illustrate the key concepts associated with finding bottlenecks in these subcomponents. Our final stop will consist of a quick tour of some of the Windows NT Server Resource Kit utilities. So, let’s begin our tour of duty with the Task Manager.
Using The Task Manager For Quick Performance Tuning
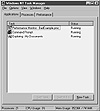
In prior versions of Windows NT, the Task Manager was used primarily to kill nonresponding applications. While it still performs this function, the Task Manager has been enhanced to include the functionality of the Process Viewer. Previously, the Process Viewer was provided only with a software development kit (SDK) or the Windows NT Resource Kit. Now, you get this same functionality for free. The Task Manager can also be used to monitor how well the core operating system components are functioning. To launch the Task Manager, right-click on the taskbar, and choose Task Manager from the pop-up menu. When you do this, the dialog shown in Figure 6.1 should appear.

Figure 6.1 The Task Manager Applications property sheet.
The Applications property sheet displays the user applications that are currently executing along with the application’s status. If the application status is Not Responding, either the application is too busy to respond to the control request or it is no longer functioning properly. Should this occur, select the application, and click the End Task button to terminate the application. You should not terminate the application, however, except as a last resort, because doing so may not inform any dynamic link libraries (DLLs) that the application has terminated. This may prevent the application from being restarted, leave the DLL in an inconsistent state, or may not release system resources used by the application. You can also make the selected application the current application by clicking the Switch To button. Or, you can launch a new application by clicking the New Task button to display the Create New Task dialog box, where you can specify the full path and application name of the program to run.
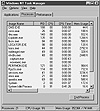
The status bar on the bottom of the dialog box is visible when any of the property sheets is displayed. The status bar includes three fields: Process, CPU Usage, and Mem Usage. The Process field specifies the total number of executing processes on the computer. The CPU Usage field specifies the total percentage of the processor currently in use. The Mem Usage field specifies the Total and Limit values for committed memory (more on this topic a little later). To obtain additional information about the processes currently executing on your system, click the Process tab to display the Processes property sheet displayed in Figure 6.2.

Figure 6.2 The Task Manager Processes property sheet.
| Previous | Table of Contents | Next |