| Previous | Table of Contents | Next |
The base information displayed on the Processes property sheet includes the Image Name, PID, CPU, CPU Time, and Mem Usage. You can view additional information, however, by choosing Select Columns from the View menu. This will display the Select Columns dialog box, where you can choose from the following items:
- • Image Name—Name of the application.
- • PID—Process identification number.
- • CPU—Percentage of processor usage.
- • CPU Time—Total processor time used by the application.
- • Mem Usage—Amount of memory currently in use by the application.
- • Memory Usage Delta—Difference in the memory previously allocated and the amount currently allocated.
- • Page Faults—Number of page faults required by the application.
- • Page Fault Delta—Difference in the number of page faults previously required by the application, and the number of page faults currently required.
- • Virtual Memory Size—Amount of virtual memory currently allocated to the application.
- • Paged Pool—Amount of pageable memory currently allocated to the application.
- • Non-paged Pool—Amount of non-pageable memory currently allocated to the application.
- • Base Priority—Default process priority level.
- • Handle Count—Number of handles in use by the application.
- • Thread Count—Number of threads in use by the application.
- • PID—Process identification number.
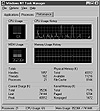
To terminate a process, you should normally use the application’s Exit menu command or the Control Panel Services applet to stop a running service. If a process will not respond to these control requests, however, you can terminate it by selecting the process and clicking the End Process button. Use this method as a last resort, because when you click the End Process button, you run the risk of leaving the operating system in an unstable state or of not releasing all resources used by the process. To obtain basic performance statistics on your system, select the Performance tab to display the property sheet shown in Figure 6.3.

Figure 6.3 The Task Manager Performance property sheet.
The Performance property sheet displays information about the core system functions. This includes the following information:
- • CPU Usage—Current percentage of the total processor capability in use.
- • CPU Usage History—Line chart of the CPU usage.
TIP: If you have more than one processor installed on your computer, you will have multiple CPU Usage and CPU Usage History fields.- • MEM Usage—Total amount of committed memory currently in use.
- • MEM Usage History—Line chart of the MEM usage.
- • Totals—This field is subdivided into the following three fields:
- • Handles—Total number of handles in use.
- • Processes—Total number of processes in use.
- • Threads—Total number of threads in use.
- • Processes—Total number of processes in use.
- • Physical Memory (K)—This field is subdivided into the following three fields:
- • Physical Memory—Total amount of physical memory installed in the system.
- • Available—Total amount of physical memory currently unused in the system.
- • File Cache—Total amount of physical memory currently allocated to the system-wide file cache.
- • Available—Total amount of physical memory currently unused in the system.
- • Commit Charge (K)—This field is subdivided into the following three fields:
- • Total—Total amount of memory currently allocated by the system.
- • Limit—Total amount of memory available to the system.
- • Peak—Total amount of memory used by the system.
- • Limit—Total amount of memory available to the system.
- • Kernel Memory (K)—This field is subdivided into the following three fields:
- • Total—Total amount of memory in use by the system kernel.
- • Paged—Total amount of pagable memory in use by the kernel.
- • Non-paged—Total amount of non-pagable memory in use by the system.
- • Paged—Total amount of pagable memory in use by the kernel.
- • CPU Usage History—Line chart of the CPU usage.
I really like to use the Performance property sheet to give me a quick status report of the health of a Windows NT system. I think you will like the Performance property sheet too because the display is easy to read and almost self-explanatory. If you minimize the display, it will display the CPU usage as an icon on the taskbar. While this can provide a basic grasp of how well your system is performing, it cannot provide all the information you need to monitor your system’s performance. This is where the Performance Monitor steps into the fray of trying to isolate a system bottleneck, as you will find out in the next section.
| Previous | Table of Contents | Next |