| Previous | Table of Contents | Next |
Creating Reports
The Report view is useful for viewing large amounts of performance object counters simultaneously. The only hitch is that the counter value displayed is always the last known value of the counter. You cannot view a series of values over a period of time. Only a chart view in line graph mode can display a series of counter data over a period of time. You will find the Report view most useful for monitoring complex items, such as your entire network. For example, network-related counters include objects such as AppleTalk, Browser, FTP Server, ICMP, IP, Gateway Services For NetWare, MacFile Server, NBT Connections, NetBEUI, NetBEUI Resource, Network Interface, Network Segment, NWLink IPX, NWLink SPX, NWLink NetBIOS, RAS Port, RAS Total, Redirector, Server, Server Work Queues, TCP, UDP, and WINS Server. Now, that is an awful lot of object counters to monitor. And if you have installed other network components or third-party products, you may have even more object counters.
To create a report, follow the steps presented here.
- 1. Make sure the default view, as shown in Figure 4.6, is set for a report. If a different view is displayed, you can click the View Report Data button on the toolbar, choose View|Report, or press Ctrl+R.
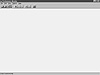
Figure 4.6 The Performance Monitor Report view.- 2. Next, choose Edit|Add To Report, press the Add Counter button on the toolbar, or press Ctrl+I. All of these selections will display the Add To Report dialog, as displayed in Figure 4.7. The Add To Report dialog is similar to the Add To Chart dialog and is used to select the performance object counters to be monitored.
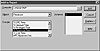
Figure 4.7 The Add To Report dialog.- 3. Now, choose the event type (performance object) to be monitored in the Object field.
- 4. Then, choose the event subtype (object counter) to be monitored in the Counter field.
TIP: If you are unsure of the counter’s properties, click the Explain button. This action will expand the dialog and display a short description of the counter.- 5. Choose an instance of the object counter, if applicable.
TIP: You can select a different computer to monitor by specifying the name of a remote computer in the Computer field. Once you have selected the computer, repeat Steps 3 through 5. This is very useful for monitoring multiple servers simultaneously to quickly check the load of a particular server.- 6. When you have made your choices, press the Add button to add the object counter to the Performance Monitor’s display list.
- 7. Repeat Steps 2 through 6 for each object counter to be monitored. When you have finished, press the Done button to return to the Performance Monitor Report view.
Note: To change the update interval for an automatic update, specify a value (in seconds) for the Periodic Update option. To change from automatic to manual updates, select the Manual Update option. Just remember, if you choose the Manual Update option, the chart will only be updated when you select Options|Update Now, press the Update Counter Data button on the toolbar, or execute Ctrl+U.
TIP: Don’t forget to save your report configuration by choosing the File|Save Report Settings As menu option. You never know when you may want to use this configuration again. - 2. Next, choose Edit|Add To Report, press the Add Counter button on the toolbar, or press Ctrl+I. All of these selections will display the Add To Report dialog, as displayed in Figure 4.7. The Add To Report dialog is similar to the Add To Chart dialog and is used to select the performance object counters to be monitored.
)
)
Creating Alerts
The Alert view is the best way to automatically inform you of a problem with your server. You can use the Alert view to inform you of low disk space, high processor utilization, network errors, or other items. One thing to keep in mind about alerts is that an alert can only be sent if the Performance Monitor is running. If you want to automate specific alerts, then you should obtain the Windows NT Resource Kit or check the Microsoft FTP site (ftp.microsoft.com) for a downloadable copy. This includes the DATALOG.EXE program, which can perform the same alerting and logging features as the Performance Monitor but runs as a service. The MONITOR.EXE program is used to install the service, and stop and start the alert or logging features.
Note: In order to use the Windows NT Resource Kit alerting and logging service, you must first create a Performance Monitor workspace file that contains your alert and log settings. If you will be monitoring any activity on a remote computer, be sure to create a user account with sufficient network privileges. When configuring the service startup values, configure the service to use the Logon Account option in the Log On As group.
| Previous | Table of Contents | Next |